Stores by prefecture And Number of stores
Stores by prefecture
March 31.FY 2026
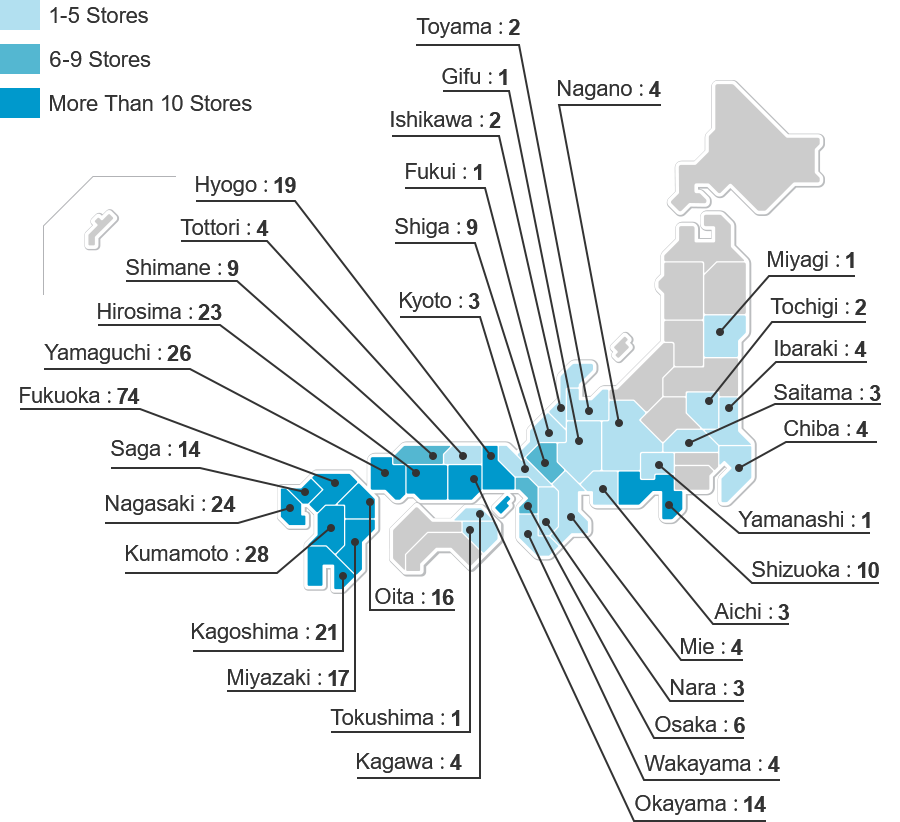
Kyusyu
| Fukuoka | 73 |
|---|---|
| Saga | 14 |
| Nagasaki | 24 |
| Kumamoto | 29 |
| Oita | 16 |
| Miyazaki | 17 |
| Kagoshima | 21 |
Shikoku
| Kagawa | 3 |
|---|---|
| Tokushima | 1 |
Chugoku
| Tottori | 4 |
|---|---|
| Shimane | 9 |
| Okayama | 14 |
| Hiroshima | 23 |
| Yamaguchi | 26 |
Kansai
| Mie | 4 |
|---|---|
| Shiga | 8 |
| Kyoto | 3 |
| Osaka | 6 |
| Hyogo | 19 |
| Nara | 3 |
| Wakayama | 3 |
Chubu
| Toyama | 2 |
|---|---|
| Ishikawa | 3 |
| Fukui | 1 |
| Yamanashi | 1 |
| Nagano | 4 |
| Gifu | 1 |
| Shizuoka | 10 |
| Aichi | 3 |
Kanto
| Ibaraki | 4 |
|---|---|
| Tochigi | 2 |
| Saitama | 3 |
| Chiba | 4 |
Tohoku
| Miyagi | 1 |
|---|
Percentage by region
March 31.FY 2026
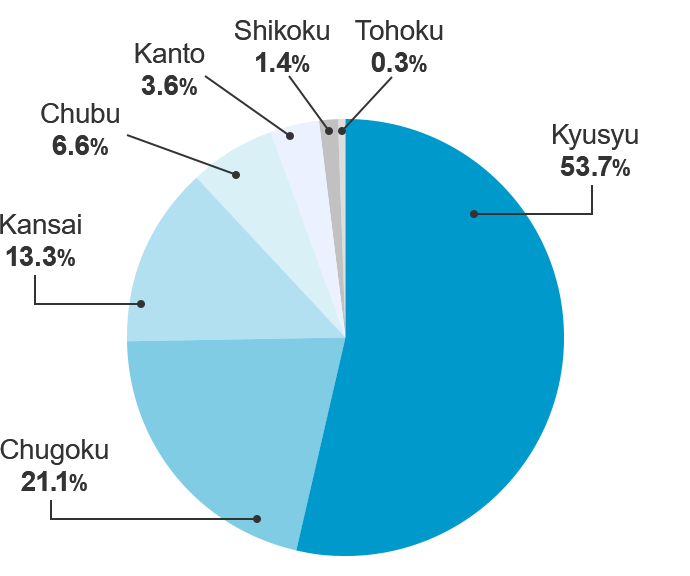
| Area | Number of stores | Percentage |
|---|---|---|
| Kyusyu | 194 | 54.0% |
| Chugoku | 76 | 21.2% |
| Kansai | 46 | 12.8% |
| Chubu | 25 | 7.0% |
| Kanto | 13 | 3.6% |
| Shikoku | 4 | 1.1% |
| Tohoku | 1 | 0.3% |
| Total Number of stores | 359 | 100% |
Number of stores
March 31.FY 2026
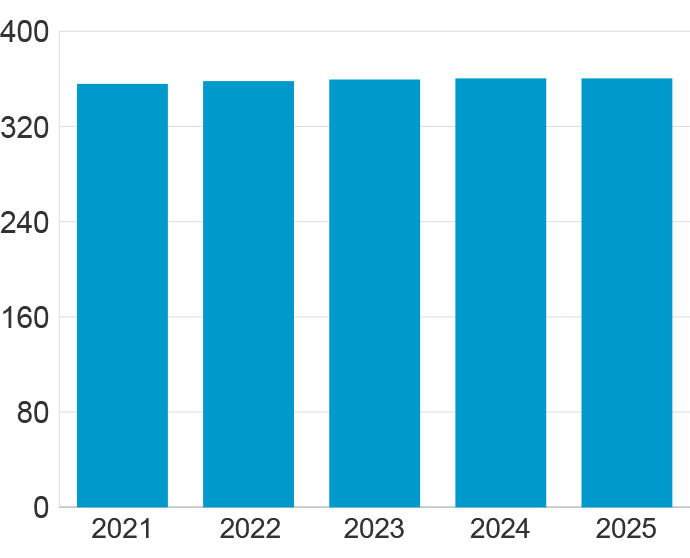
| Number of stores | |
|---|---|
| FY2021 | 359 |
| FY2022 | 360 |
| FY2023 | 361 |
| FY2024 | 360 |
| FY2025 | 359 |
Percentage by store type
March 31.FY 2026
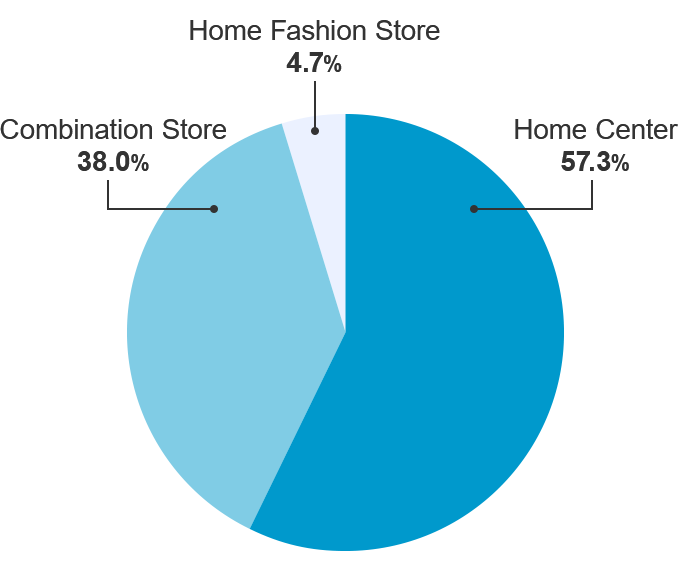
| Number of stores | Percentage | |
|---|---|---|
| Home Center | 207 | 57.7% |
| Combination Store | 137 | 38.1% |
| Home Fashion Store | 15 | 4.2% |